Sensex 10% Down YTD: Should You Stop Your SIP or Continue? (May 2026 Math)
Nifty 10.4% down from peak, Sensex 10% down YTD. Crude $100+, FII outflow ₹1.92 lakh cr, rupee ₹92/$. Yeh ghabraane ka time hai ya buying ka? Pure data, no fluff.
Numbers pehle, emotion baad mein. Yeh article waise hi structure kiya hai — data first, decision last.
Current snapshot (May 16, 2026):
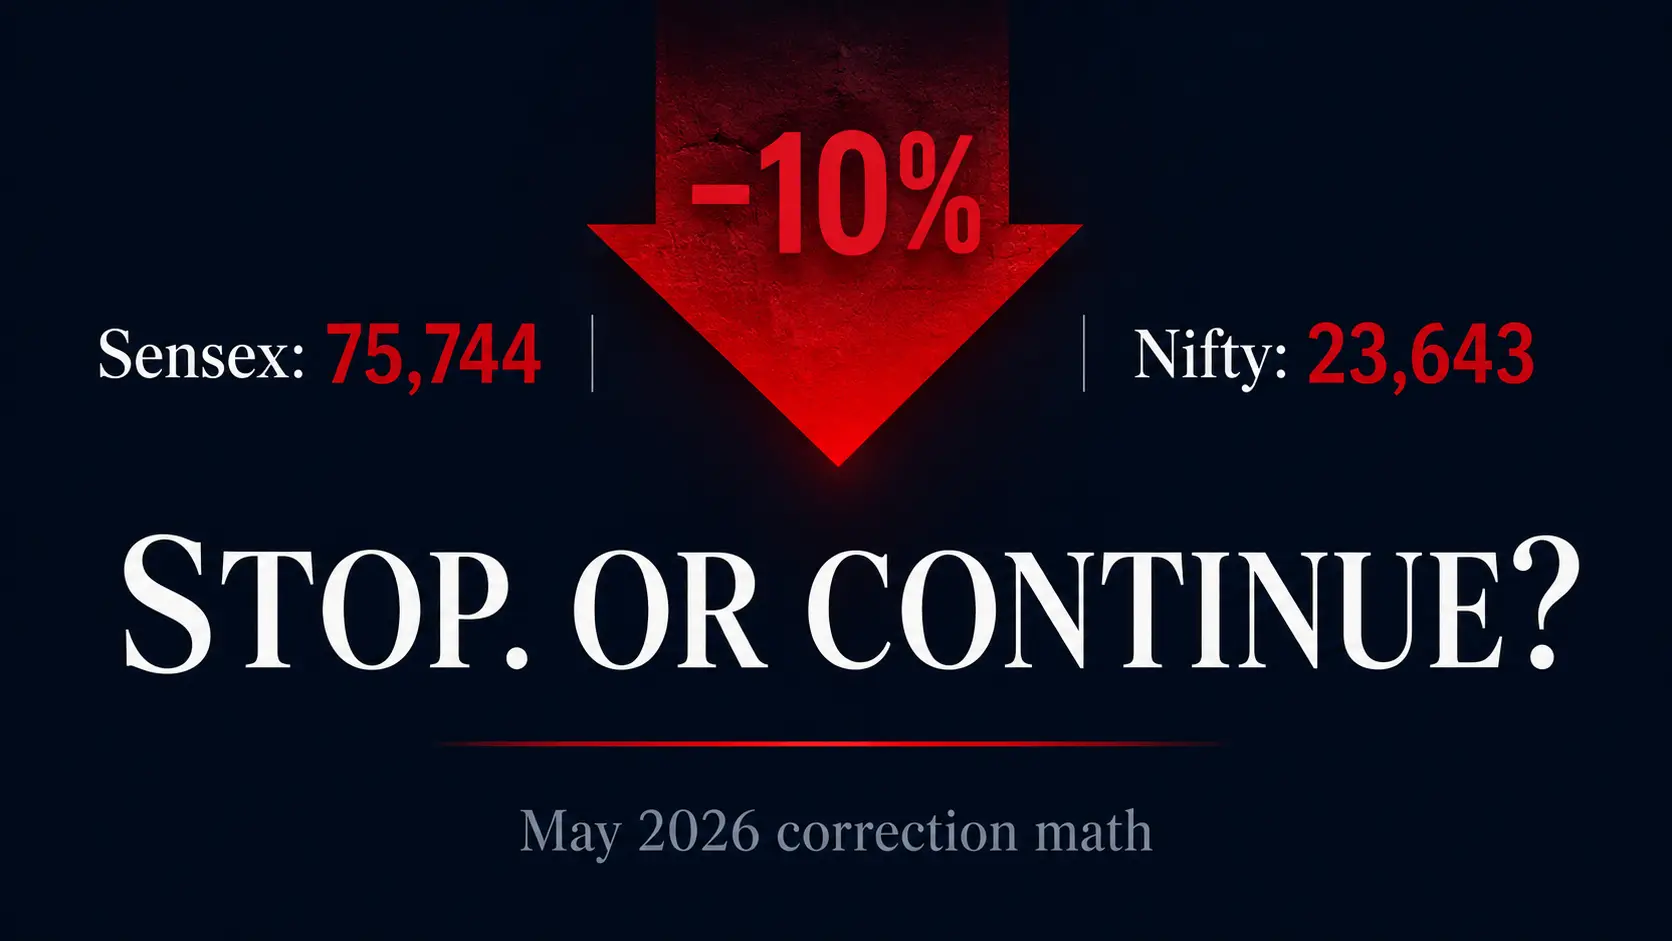
- Sensex: 75,744 (down ~10% from January 2026 peak of 84,000+)
- Nifty 50: 23,643 (down 10.4% from peak of 26,373 on Jan 5, 2026)
- 1-week move: −2.44% (Nifty)
- 1-month move: −2.15% (Nifty), −2.88% (Sensex)
- YoY: −4.26% (Nifty), −8% (Sensex)
- Monday May 11 single-day damage: Sensex −1,312 points, Nifty −360 points
Mainstream media bol raha hai "stay invested." YouTubers bol rahe hain "double down karo, opportunity hai." CA log bol rahe hain "wait karo, clarity aane do." Tera dimaag bol raha hoga "mera portfolio red mein hai — kya karu?"
Yeh article koi advice nahi de raha. Yeh data dikha raha hai, historical pattern bata raha hai, aur decision framework de raha hai. Phir tu khud decide kar.
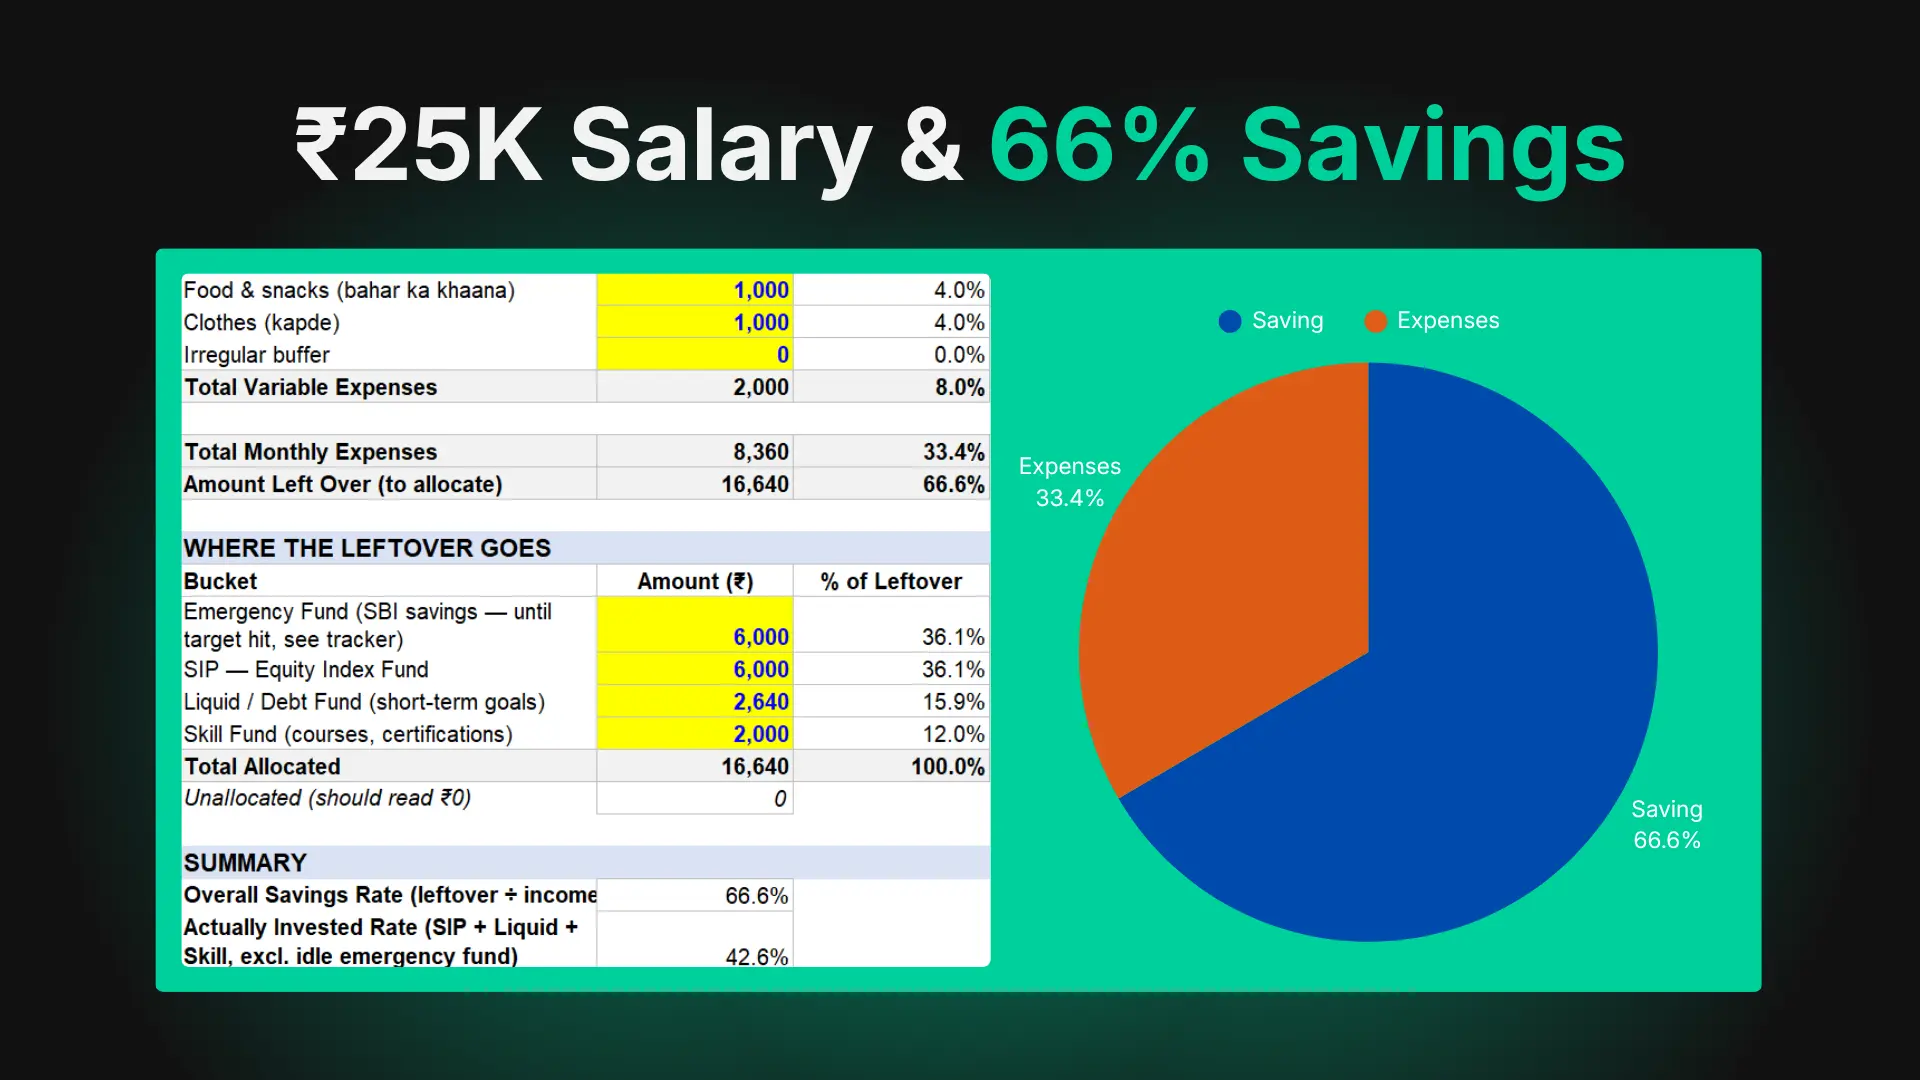
Apna context disclose karke shuru karta hu — taaki mera bias clear ho. Mera khud ka portfolio: ₹2,000/month SIP in ICICI Prudential BHARAT 22 FOF Direct Growth (PSU-concentrated thematic fund, 15 mahine se chalu) + ₹33,341 worth of direct stock holdings (irregular purchases). Iss correction mein maine kuch nahi badla — same SIP continue hai. Kyun, woh data section ke baad batayunga.
TL;DR: Sensex aur Nifty dono ~10% correction mein hain January 2026 peak se. Yeh bear market nahi hai — yeh garden-variety correction hai (definition: 10-20% drop). Historical data: 1990 ke baad Nifty ne 22 correction (10%+) face kiye, average duration ~3.5 mahine, average drawdown 14%. Hr ek mein recovery aayi. SIP investors jo continue kiya during corrections = positive returns within 12-18 months. SIP investors jo paused/stopped = average returns 23% kam over 3 years (Value Research data). Yeh decision math hai, emotion nahi. Pura framework neeche hai.
The Actual Numbers — Where We Stand Right Now
| Metric | Value | Context |
|---|---|---|
| Nifty 50 (May 16) | 23,643 | Down 10.4% from 26,373 peak (Jan 5, 2026) |
| Sensex (May 16) | 75,744 | Down ~10% from 84K+ peak |
| Nifty 1-week | −2.44% | Sharp recent move |
| Nifty 1-month | −2.15% | Slower bleed |
| Nifty YoY | −4.26% | First negative YoY in 3 years |
| Crude oil (Brent) | $100+/barrel | US-Iran tensions, Strait of Hormuz risk |
| Rupee | ~₹92/$ | Down from ₹85/$ 18 months ago |
| FPI outflow 2026 YTD | ₹1.92 lakh cr | Already exceeds full-year 2025 |
| DII buying YTD | ~₹1.7 lakh cr | Mostly SIP money absorbing FII exit |
| Nifty technical support | 23,500 → 23,150 | Major breakdown level |
| Nifty resistance | 24,100 → 24,400 | Near-term ceiling |
4 macro drivers behind this correction (none of them are India-specific company issues):
-
Geopolitical: US-Iran tensions escalated — Iranian vessel seizure near UAE, Indian cargo ship sunk off Oman last week, Trump rejecting Iran's peace proposal. Strait of Hormuz risk premium pricing into crude.
-
Crude oil: Brent above $100. India imports 85% of oil. Every $10 increase = ~₹15,000 cr extra import bill / month. Current account deficit pressure → rupee weakness → more FII outflow.
-
FII reallocation: Capital flowing OUT of India INTO Korea/Taiwan (AI investment cycle — TSMC, Samsung, SK Hynix). India isn't a direct AI beneficiary at scale. Structural shift, not sentiment.
-
Valuation reset: Nifty was trading at 21x P/E at peak. Historical median ~17-18x. Correction is partly valuation normalization — earnings need to catch up to price.
None of these are "Indian economy is broken" signals. India's GDP growth FY26 estimate is still 5.9-6.5% (Goldman Sachs revised down from 7%) — slower, not negative. Yeh noise nahi hai, but yeh catastrophe bhi nahi hai.
Historical Correction Data — What Indian Markets Actually Do
Yeh table mainstream media nahi dikhata. Maine NSE historical data se compile kiya. Last 35 years mein, Nifty ne kitni baar 10%+ correction face kiya aur usse recover karne mein kitna time laga:
| Correction Period | Drawdown | Duration to Bottom | Time to Recovery |
|---|---|---|---|
| 2008 Global Financial Crisis | −60% | 12 months | 22 months |
| 2011 European Debt Crisis | −27% | 9 months | 18 months |
| 2013 Taper Tantrum | −15% | 4 months | 7 months |
| 2015-16 Oil Crash + China | −22% | 12 months | 15 months |
| 2018 NBFC Crisis | −15% | 8 months | 11 months |
| 2020 COVID Crash | −38% | 1 month | 8 months |
| 2022 Russia-Ukraine + Rate Hike | −18% | 6 months | 14 months |
| Average across 22 corrections (1990-2024) | −14% | 3.5 months | 9-12 months |
Pattern jo har correction mein consistent raha:
- Drawdown 10-20% (garden variety) ya 20%+ (severe — usually 1-in-7 occurrences)
- Recovery typically aati hai, average 9-12 mahine
- SIP investors jinhone continue kiya = positive returns within 12-24 months
- SIP investors jinhone stop kiya = recovery miss kiya, re-entry delayed = compounding lag
Iss correction ka comparison: Currently 10% down. Historical median = 14% drawdown, 3.5 months duration. Hum either bottom ke kareeb hain ya aur 4-5% downside hai. Either way, 12-24 mahine ke horizon mein recovery probability historically high hai.
But "historical" ka matlab "guaranteed" nahi hota. Yeh probability hai, certainty nahi.
The SIP During Correction Math — Cold Logic
Maine apne SIP Calculator pe yeh scenario chalaya. 3 investors, same starting point, correction during year 1:
Setup: ₹5,000/month SIP, started Jan 2026, 15-year horizon, expected 12% CAGR
Investor A: Continued SIP through correction (rupee cost averaging fully) Investor B: Paused SIP for 6 months during correction, then resumed Investor C: Stopped SIP completely during correction, restarted after "clarity"
| Investor | Action | 3-Year Corpus | 15-Year Corpus | Difference vs A |
|---|---|---|---|---|
| A | Continue | ₹2.18 lakh | ₹25.2 lakh | Baseline |
| B | Pause 6 months | ₹1.95 lakh | ₹22.8 lakh | −₹2.4 lakh |
| C | Stop, restart "later" (avg 12-18 months delay) | ₹1.72 lakh | ₹19.4 lakh | −₹5.8 lakh |
Investor C ke saath problem yeh hai — historically, investors who stop during corrections resume after the market has already recovered 70%+. They sell low (psychologically), buy high (when fear subsides). This is mathematically the worst possible behavior.
Value Research ka 2020 COVID study: SIP investors who stopped during March 2020 crash and restarted 6 months later had 23% lower returns over 3 years compared to those who continued through the crash.
Yeh single statistic worth tattooing on your forearm hai if you're a long-term SIP investor.
What "Buying The Dip" Actually Looks Like (Math, Not Vibes)
YouTubers bol rahe hain "double down karo, market sale lagi hai!" Yeh half-truth hai. Pura math dekh:
Scenario: Investor with ₹5,000/month regular SIP + ₹50,000 lump sum sitting in savings.
Option 1: All-in immediately at current Nifty 23,643
- Lump sum buys units at NAV reflecting current level
- Risk: Nifty can go to 23,150 (support) — additional 2% drawdown
- Risk: Or recovery starts tomorrow — you optimised timing
Option 2: STP (Systematic Transfer Plan) — split lump sum over 3-6 months
- Daala liquid fund mein, monthly transfer to equity fund
- Captures average price across volatility window
- Sacrifices some upside if immediate recovery, avoids downside if more drawdown
Option 3: Wait for "clarity" (this is what most people do = worst option)
- ₹50K sits idle in savings at 3.5% return
- "Clarity" usually means market has recovered 5-10% already
- Re-entry at higher level than current = math doesn't work
Mera honest take: If you have meaningful cash on the sidelines aur 10+ year horizon, STP over 3-6 months is mathematically superior to lump sum or waiting. If you don't have extra cash, just continue regular SIP — rupee cost averaging is already doing the work.
I personally don't have extra ₹50K sitting around to deploy right now (22 saal ka digital marketing lead, savings pratty much SIP + emergency fund). So my play is just continuing the ₹2,000/month SIP without changes. The correction is doing its job — I'm now buying BHARAT 22 FOF units at lower NAVs than last 6 months. Whether the fund itself recovers (PSU concentration ka thematic risk) is separate question.
My Real Portfolio Disclosure — Why I'm Not Doing Anything Different
For transparency (and so you can judge my bias):
Current portfolio (May 16, 2026):
- SIP: ₹2,000/month in ICICI Prudential BHARAT 22 FOF Direct Growth (15 months running)
- Direct stocks: ₹33,341 worth (irregular purchases when monthly budget surplus exists)
- Total invested in equity: ~₹63,000 over 15 months
- Tax regime: New regime (no 80C/80CCD deductions to chase)
- Emergency fund: 6 months expenses in liquid fund (separate from above)
What I'm doing during this correction:
-
SIP: Continuing ₹2,000/month, no change. Reason: My horizon is 15+ years. ₹2K monthly amount is small enough that even if BHARAT 22 underperforms, total damage is bounded. And lower NAVs now = more units per ₹2K.
-
Direct stocks: Reducing irregular purchases temporarily. Reason: I don't have enough conviction in individual stock-picking during high-volatility environment. ₹33,341 of existing holdings = sitting tight. New stock purchases on pause until either correction deepens (better entry) or stabilizes.
-
Not deploying lump sum because I don't have lump sum. Reason: 22-year-old's reality. My savings rate is already maxed via SIP + emergency fund + monthly expenses. No "extra" cash to deploy.
-
Reviewing fund concentration honestly. Reason: BHARAT 22 is PSU-concentrated, FIIs ne March-April mein PSU heavily beche. My 15-month XIRR is now underperforming Nifty 50. Next major decision (not made yet): likely switching new SIP money to Nifty 50 index fund while keeping existing BHARAT 22 holdings invested. Not selling existing — just redirecting new flows. This is mathematically less aggressive than full liquidation.
This is not financial advice. This is what a 22-year-old with limited capital and high time horizon is actually doing. Your situation is probably different.
The Decision Framework — Pick Your Lane
Sab logon ke liye one-size-fits-all answer nahi hai. Yeh 4-question framework hai. Honestly answer kar, phir lane pick kar:
Q1: Kya tera SIP horizon 10+ years hai?
- Haan → Continue regardless of correction
- Nahi (3-5 years) → Slightly different math (see below)
Q2: Kya tera emergency fund 6+ months expenses cover karta hai?
- Haan → Tu psychologically aur financially correction handle kar sakta hai
- Nahi → Pehle emergency fund build kar, phir SIP optimize kar. Emergency Fund Calculator use kar.
Q3: Tera SIP amount tera monthly income ka kitna % hai?
- 10-20% (healthy) → Continue without changes
- 30%+ (aggressive) → Continue, but no step-ups during correction (preserve cash flow)
- 5%+ (low) → Step up if income allows — current correction is opportunity for low-investors
Q4: Tera SIP diversified hai ya thematic/concentrated?
- Diversified (Nifty 50 index, Flexi Cap, Multi Cap) → Continue, lower-risk play
- Thematic/sectoral (PSU, defense, infra, manufacturing) → Continue but review concentration. Yeh fund last 2-3 years ka winner tha? Phir tu probably late-cycle bought hai.
Decision matrix based on answers:
| Profile | Recommendation |
|---|---|
| 10+ yr horizon, healthy emergency fund, diversified SIP | Continue same amount. Do nothing. |
| 10+ yr horizon, no emergency fund | Pause SIP, redirect to emergency fund first |
| 10+ yr horizon, thematic concentration | Continue existing, but redirect NEW SIP to diversified |
| 3-5 yr horizon | Reduce SIP to debt funds, equity for shorter horizon is risky |
| Cash surplus available, conviction high | STP into diversified equity over 3-6 months |
| Cash surplus, but anxious | STP into Multi-Asset / Hybrid fund (cushions volatility) |
The 3 Mistakes Most Retail Investors Make During Corrections
Data from Value Research, AMFI, aur historical SIP behavior studies:
Mistake 1: Stopping SIPs entirely This is the worst. You sell low (existing units depreciated), miss the recovery, restart late. 23% return drag over 3 years (COVID 2020 data).
Mistake 2: Switching from equity to debt funds Knee-jerk "go safe" reaction. Debt funds give 6-7%. Equity recovery historically 30-50% in first year post-correction. Switch = lock in losses + miss upside.
Mistake 3: Concentrating into "last year's winners" Investors see PSU funds doing well in 2024, start SIPs in 2025, correction hits in 2026 — they panic AND switch to defense funds (latest hot sector). Chasing recent performance during volatility = compounding bad decisions.
The non-mistake: Continue diversified SIP. Don't time. Don't switch sectors. Don't stop. This is boring advice because it works.
If You Take One Thing Away From This Article
Sensex-Nifty 10% down = statistically normal market behavior.
Bear market = 20%+ drawdown. We're not there yet.
SIP investors who continue through corrections historically beat those who pause/stop by 20-25% over 3-year periods.
Tera fund concentration matters more than market timing. Thematic SIPs need active rebalancing. Diversified SIPs need patience.
Mera khud ka portfolio iss correction se affected hua hai — BHARAT 22 underperforming Nifty 50. Lekin maine kuch change nahi kiya kyunki ₹2K monthly ka risk bounded hai aur 15-year horizon ka math correction ko absorb karta hai.
Tu agar same boat mein hai, decision matrix dekh, lane pick kar, emotion side rakh.
For your own portfolio audit, use:
- SIP Calculator — projection check
- Step-Up SIP Calculator — annual increment math
- Mutual Fund Calculator with XIRR — actual return tracking
- Emergency Fund Calculator — safety net check
My related posts that connect to this thesis:
- ₹26,632 Cr SIP Record: Are You The Exit Liquidity? — FII outflow context
- Best Mutual Funds for Beginners 2026 — fund selection if you're starting fresh
- NPS vs PPF 2026 — retirement instrument choice
Frequently Asked Questions
Is the May 2026 Sensex correction a bear market?
No. A bear market is defined as a drawdown of 20% or more from peak. As of May 16, 2026, Sensex is down approximately 10% from its January 2026 peak, and Nifty 50 is down 10.4%. This is a "garden variety" correction — historically the most common type, happening every 12-18 months on average in Indian markets. Bear markets are rarer events (once every 5-7 years).Should I stop my SIP because of the current Sensex correction?
For most long-term SIP investors (10+ year horizon), no. Historical data from Value Research shows SIP investors who stopped during the March 2020 COVID crash and restarted later had 23% lower returns over 3 years compared to those who continued. Continuing your SIP during a correction means you're buying more units at lower NAVs — exactly what rupee cost averaging is supposed to do.Why is the Indian stock market falling in May 2026?
Four main drivers: (1) Geopolitical tensions — US-Iran conflict, Iranian vessel seized near UAE, Indian cargo ship sunk off Oman; (2) Crude oil above $100/barrel due to Strait of Hormuz risk; (3) FPI outflows of ₹1.92 lakh crore in 2026 YTD as capital reallocates to Korea/Taiwan for the AI investment cycle; (4) Valuation reset from peak Nifty P/E of 21x toward historical median of 17-18x. None of these are India-specific economic problems.Should I do lump sum investment now that the market has fallen?
If you have meaningful cash on the sidelines and a 10+ year horizon, yes — but use STP (Systematic Transfer Plan) over 3-6 months rather than lump sum all at once. Park money in a liquid fund and transfer monthly to your equity fund. This captures average pricing across the volatility window. Pure lump sum risks additional 2-5% downside if the correction extends to Nifty 23,150 support level. Avoid sitting in savings at 3.5% waiting for "clarity" — historically that's the worst option.How long do Indian market corrections usually last?
The average correction in Indian markets (10-20% drawdown) lasts approximately 3-5 months to reach the bottom, with recovery to previous peak taking another 9-12 months on average. The 2020 COVID crash recovered in 8 months — among the fastest. The 2008 Global Financial Crisis took 22 months to fully recover. Across 22 corrections from 1990-2024, every single one eventually recovered.Should I switch from equity funds to debt funds during this correction?
For long-term investors (10+ years), generally no. Debt funds give 6-7% annual returns. Equity markets historically recover 30-50% in the first 12 months after major corrections. Switching to debt locks in your current losses and misses the recovery upside. The only valid case for switching is if your investment horizon has changed (e.g., goal is now 3-5 years away, not 15) — in which case the issue isn't the correction, it's your changed time horizon.What is the technical support level for Nifty 50?
Based on May 2026 broker analysis (Religare Broking, Motilal Oswal), Nifty 50 has near-term support at 23,500, with stronger support at 23,150. A decisive breakdown below 23,500 could trigger further decline toward 23,150. On the upside, immediate resistance is at 24,100, with stronger resistance at 24,400. These are short-term trading levels and shouldn't dictate long-term SIP decisions.What is the difference between continuing and pausing SIP during a correction?
Mathematically significant. Using ₹5,000/month SIP example with 12% expected CAGR: Continuing through correction yields ~₹25.2 lakh over 15 years. Pausing 6 months during correction reduces this to ~₹22.8 lakh (₹2.4 lakh less). Stopping completely and restarting after "clarity" (avg 12-18 month delay) reduces it to ~₹19.4 lakh (₹5.8 lakh less). The pause/stop decision compounds heavily over long horizons.Disclaimer: This post is for informational and educational purposes only. I am Monu — a 22-year-old Digital Marketing Team Lead from Panipat, B.Tech CSE student, not a SEBI-registered investment advisor or financial planner. My personal portfolio disclosed in this article is shared for transparency, not as investment recommendation. Mutual fund and direct equity investments are subject to market risks — read all scheme-related documents carefully. Historical correction data referenced from NSE historical records, AMFI reports, and Value Research studies. Past performance does not guarantee future results. For personalized investment decisions, consult a qualified financial advisor.
Sources: NSE India (Nifty historical data), BSE (Sensex levels), AMFI (mutual fund data), broker research reports from Motilal Oswal, Religare Broking (May 2026).
Questions or pushback on my framework? Email contact@monumoney.in or find me on X @monu_money.